Is the 24 month rolling sales and operations plan (sales,
inventory and production) the right focus. Is the time and effort expended by such a powerful, expensive, multi-disciplinary S&OP team the correct use of your resources?
Shouldn't such a strong team focus on how to get the most Throughput (the rate at which the business makes money) for the company? Could your S&OP be the integrating function that brings all business functions together, into one, truly powerful and effective unit?
Shouldn't such a strong team focus on how to get the most Throughput (the rate at which the business makes money) for the company? Could your S&OP be the integrating function that brings all business functions together, into one, truly powerful and effective unit?
This article describes the current process as I understand it
– based loosely on APICs and Oliver Wight articles. I will include comments
that will, hopefully, hint at a (better) more effective implementation of this process.
The second part describes the criteria I suggest for a much improved process that includes execution of the plan. The concept is to design and implement a well-functioning
day to day process sensitive to change. Signals of changing demand to reliably manage stock dynamically to correct levels for reliable availability and due date
performance. A process that recovers ‘lost’ capacity, reduces inventory levels, and
increases speed of production (reduces lead times). This probably sounds like what the Germans refer to as “eine eierlegende Wollmilchsau”.
Translated into English it means “an egg-laying,
milk-producing woolly pig”!!!
My target is to describe a simple and robust process that does all the above. A process to create
opportunities for marketing and sales and (not less important) career opportunities for the S&T team members.
Sales & Operations (S&OP) Planning, Today
Definition (Based on Oliver Wight[1])
An (advanced) S&OP …
·
… is a process, led by senior management to evaluate and revise
time-phased business projections (demand, supply, product portfolio changes,
strategic projects, and the consequential financial plans). It is a monthly
process at the aggregate level with, typically, a 24-month rolling plan
horizon.
·
… is a decision-making process to re-align business functions’ tactical
plans for all geographies; to properly support the company's strategies,
business goals, and targets in a constantly changing World.
·
… primary objective is consensus on a single operating plan for which the management team is accountable. The team allocates critical resources -
people, equipment, materials, time, and money to effectively satisfy customers
profitably.
Process Description (summarised, with my comments, from an APICS article on
S&OP)
S&OP Participants
Many managers must participate in the S&OP process without understanding
its relevance to their concerns and responsibilities. If this is the perception, the S&OP is doomed to
irrelevance and failure. A successful S&OP (no matter who decided for the
process) must make sure proven relevancy and benefits are there for all
participants.
The Monthly S&OP Process Today
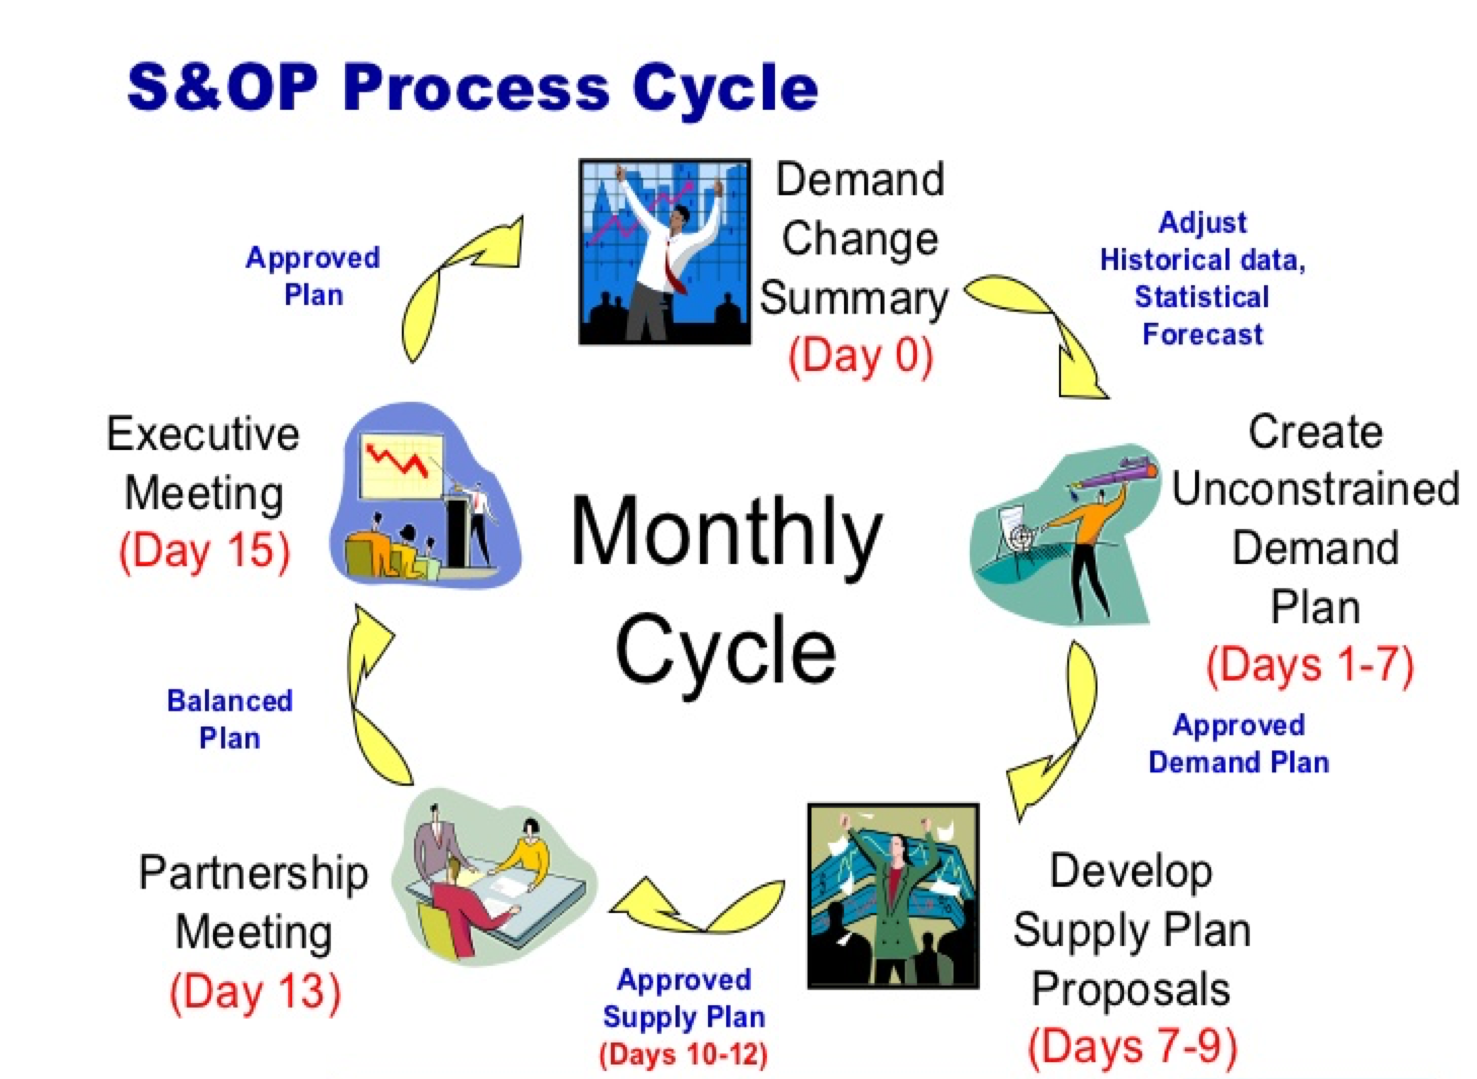
Step 1: Demand
The S&OP team gathers information to modify forecasts to
current market knowledge. The sales organisation, marketing and others input their
best customer demand knowledge. Eventually the 24-month the new demand plan will be matched
to an operations plan to fulfil requirements – the right products
produced at the right time and available in the right place. After data collection the demand meeting reviews the forecast, focuses on changes and agrees on the new forecast.
Since companies sell many different products, the S&OP
process aggregates article (detailed) demand to product families. Later these numbers are disaggregate back into the article demand. Obviously, detail information is
lost (or was never there). The regenerated demand is usually based on historical (not
future) product mix. How good can such a forecast be for those that must
produce and ship the right articles?
All forecasts are based on history and will almost
always be biased by whatever the forecaster(s) has just heard from customers
or from business news. Dr. E.M. Goldratt’s short video presentation ‘Thinking
Globally[1]’
illustrates how easily managers can be misled into questionable decisions and
actions.
Accuracy at an aggregate level is not an indication of
detail accuracy – what demand will be at an article level is anyone’s
guess. The effort that goes into demand planning is, at best, useful to plan
materials sourcing and resource capacity.
Constant cost pressure is a powerful factor when committing
to material and component purchases. When committing to more resources
(equipment and people), I suspect, strongly, that most companies delay decisions until sales increase significantly enough – often too late to capture increased demand.
Companies should use their resources effectively enough to to maintain a level of protective capacity, for both demand spikes and
increasing demand trends. Protective capacity is a powerful factor to protect the company’s reliability and speed service levels, Excellent service is essential for increased sales,
Throughput, profit and profitability.
In the short term, why not simply replenish whatever was just
sold? Why not adjust inventory targets dynamically - decrease targets if levels are always in the top third and increase levels if levels are always in the bottom third (the signal that reliable supply is at risk).
If inventory targets are not dynamically changed at the article level to recognise changing demand, the company will suffer from shortages (and lost sales) as well as surpluses (heavy discounting).
As inventories vary over time, too much or too little inventory can be made transparent. Computers can easily monitor stock levels to signal when inventory targets should change. Such a simple tool is beneficial for managing short-term demand and supply as well as warning of an impending changes in demand trends.
Such a simple tool can help manage most types of inventory. Some additional tactics are necessary for more unusual situations and things like promotions or seasonality.
Step 2: Supply
Once demand is clear the supply side meets to compare forecast demand to demonstrated capacity, resource availability and the like. Focus is not to critique the forecast, but to determine how operations will produce
the expected demand, particularly in the longer term. Operations decide how they will eliminate any blockages
(constraints) that they expect will limit their ability to produce the forecast demand.
Pressures on cost and efficiency (pressures that come from
management) often are a cause for the inability to produce enough to meet
demand. Cost and efficiency pressures cause behaviours in factories to make sure
all resources are working actively (after all “a resource standing idle is a major waste”). For efficiency's sake plants will produce in larger than necessary batches, bring future demand forward and favour the more effective products.
Such practices lead to increased lead-times, poor reliability and damage the factory's ability to produce to capacity. But, because efficiency and cost directives come from ‘on high’ they cannot be ignored.
Factories that focus on their limiting resource and that do not produce more than short term requirements generally show much better reliability, shorter lead-times and a greater capability (greater capacity from the same resources).
Step 3: Partnership Meeting
This meeting is facilitated by the S&OP team. This is the organisations leaders' meeting (finance, marketing, materials, operations, product management, and
sales leaders). Product of the meeting is the partnership plan. This is a commitment statement. The team commits to the (financial) forecast (a single set of numbers). To make the statement of commitment a reality, any problems, constraints etc. must first be resolved.
Reading what I have written, I feel that the S&OP process is elaborate
and very expensive in terms of the resource time committed to it and
the relatively small expected results. Is such a complex and time consuming process necessary?
Or is it needed to cover the failings of MRP and master scheduling?
Step 4: Executive Meeting
This meeting is for the president, managing director or CEO. Any remaining problems (there should rarely be any) are resolved here. The final commitment to the S&OP plan is made here.
Important comments
- The monthly S&OP must not start from a clean sheet. It is a change process to react correctly to changes signalled from the markets, product development, production, suppliers or other entity.
- The sales function’s assessment of the market should be compared to previous estimates –to prevent biases like sales (managers) reporting the first forecast number that pops in their head. (This warning is an indication of the low perceived value of an S&OP process!)
- Keep it simple! Yes, but sales sell articles and not product families and production produces articles and not product families.
- To ensure success be sure to get agreed timings, objectives and responsibilities. Schedule meetings well in advance!
- Be vigilant to identify struggling elements in the process so that problems can be corrected before the process fails.
These comments indicate how difficult it is to institute a
well-functioning and long-lasting S&OP process. They indicate participants often do not recognize the value of the process. If departments do not see the value how can the president see
value. The S&OP process is in need of a change to make it valuable for all
parties.
Retool
your S&OP; add Execution to the name and Process

Participants must all benefit more than the effort they put in.
 |
| "WA" = Harmony |
- Every participant knows how he or she should contribute, and knows that his or her contribution will be recognised by the group.
- Participants know how their colleagues in the process contribute and that they also will be recognised by the group.
- All the S&OP&E rules and policies are aligned with the company’s goal (mission, vision) and strategies.
- All disparities or differences between responsibility and authority are systematically identified and removed.
- The S&OP&E team is a focused continuous improvement team. The focus is on the limiting factor (constraint).
S&OP&E teams transform the supply chain into a competitive weapon.

Once short lead-times, reliability and greater
capacity are achieved the S&OP&E team have created a
competitive advantage. Now marketing and sales must develop
and sell a powerful offer, difficult for competitors to copy to take advantage of the capacity found. A good
offering requires the key parties (sales, marketing, distribution and
production) to jointly develop and sell it to clients to cause sales
increase rapidly.
Stock levels are managed dynamically to ensure better product availability and due date performance at optimal (low) inventory levels.
Inventories are a good thing! They are good if
they enable better lead-times and/or almost perfect
availability.
Stock levels follow article demand so that inventory is dynamically maintained correctly to maintain the necessary level of availability. Dynamically monitoring and adjusting stock levels is easy, if your inventory management system is continually updated (correctly).
Inventory information will show what stock is always ‘in the green’ (too much) and what stock is too often “in the red” (a risk of stock-out and missed sales). Most inventory management systems already have the necessary data – this data just needs to be translated into good information.
Products flow through the factory in less and less time – lead-times are shorter than any relevant competitor’s.
 |
| Speed and Reliability are KEY |
When an S&OP&E team causes
factory lead-times to be halved, speed and reliability will increase, lost capacity will
be re-discovered and the supply chain becomes a powerful competitive
advantage. Since 80% of lead-times will still be spent in queues there is enough potential for further improvements – for instance the flexibility to rapidly
deal with customer emergencies without jeopardising ‘normal’ business.
Production is managed to maximise overall factory capability.
Minimising work in process (see
the 2nd and 4th criterion) increases factory capability. Product flows, it does not get
stuck while personnel look for the correct next order, or looks for some other
item to produce. With half the work in process in the factory visibility
and transparency improves dramatically. Priorities become clear and product 'just' flows.
There is more to maximising
factory capability than improving flow. The constraint (the limiting factor in
the factory) can, in most factories be exploited to a much greater degree. So
much so that actions to exploit the limiting factor better often lead to it moving
to another place (other resource). With tools from 6-Sigma, Lean and just plain common sense the S&OP&E can find many ways to exploit a constraining capacity better. Significant gains are often easily possible.
The 5-focusing steps of the
Theory of Constraints are a good process to continually improve a business. The cause better exploitation of the constraint. The constraint may be internal in operations or external in the market that
is not buying enough or with suppliers that cannot supply correctly.
Protective capacity for demand spikes, variability & growth.
What is meant “protective
capacity? It is a portion of capacity to protects reliability, availability, speed and growth in
market share. If, through improving the supply chain, we generate more and more
demand, our sales to capacity ratio will climb until capacity is tight. We risk our excellent performance and consequently disappoint customers who may leave for greener pastures. Your company must increase capacity before it loses hard won new customers. Alternatively, rather than disappoint customers with poor service, your company can refuse business.
A strategy and a set of tactics
how deal with demand and capacity must exist and be operational.
The company has clear tactics to deal with growing demand without jeopardising product availability, due date reliability or promised lead-times.
Protective capacity is just one
way to deal with demand growth. The tactics to limit work in process to reduce
chaos and promote flow is another. A third is to find better ways to exploit
the company’s existing limiting factor. These may not be enough to deal with all demand growth.
Before your factory approaches capacity, the company must have prepared for the situation. It must have ways to implement expansion and have the necessary policies in place to prevent deterioration of availability, reliability and speed.
Before your factory approaches capacity, the company must have prepared for the situation. It must have ways to implement expansion and have the necessary policies in place to prevent deterioration of availability, reliability and speed.
If a company implements the three criteria mentioned above it will have increased its capability for both greater production and sales. It will, at least initially, not have to resort to added investment and cost. Profitability will have
increased so much, that an investment in the right place, at the right time must be no problem.
The S&OP&E team
recommends when (soon enough), where (the internal limiting factor) and how
capacity should be expanded. The 'how' recommendation can range from adding shifts, overtime, outsourcing and investment in added equipment.
Production & inventory management tools provide demand trend information.
An inventory management tool can
easily track the rate of sale or consumption for all products at all stocking
locations. The information can easily be presented as priorities to production and distribution in a simple visual form. The tool could also
compare consumption or sales over time to recognise and present significant
trends as they progress. The S&OP&E team has members that should be
able to explain and justify the identified trends to decide the likely
scenario(s) in the 6-24-month horizon. The logic of the conclusions must be
carefully reviewed and challenged by the team and independently by senior management. These
scenarios, once accepted, help determine investment and sourcing
commitments that need to be made.
Production time buffer
consumption statistics can confirm the same sort of information in make-to-order production environments. Time buffers represent the planned time to produce a product.
Buffers are split into green, yellow, red and black (late delivery) zones. As
demand approaches a factory’s capability the relative number of orders in each
zone will change – as demand increases we expect the number of reds (and blacks) to increase. More and more reds and blacks indicate it may be time for the S&OP&E team to act.
Pending Orders and production & inventory management tools provide load information for the 2-4 most loaded resources (machines).
Customer orders are your most
important information. They will either consume finished inventory or cause the
factory to produce. Either way client orders place a load on the
factory, especially on its limiting factor, and possibly on some other equipment which may
not have much more capacity than the constraint.
Since the MRP (part of ERP)
contains production lead-times we can know what the latest start
date for a Make to Order order is.
As soon as an item is sold out of finished inventory a demand on manufacturing that could be produced is created. The generic rule is; production may produce at any time as long as inventory targets are not exceeded. Production must produce if stock levels are in the red zone – generically the last 1/3 of target inventory levels. Orders and inventory levels together give the S&OP&E team the possibility to determine planned load for the few critical key resources.
As soon as an item is sold out of finished inventory a demand on manufacturing that could be produced is created. The generic rule is; production may produce at any time as long as inventory targets are not exceeded. Production must produce if stock levels are in the red zone – generically the last 1/3 of target inventory levels. Orders and inventory levels together give the S&OP&E team the possibility to determine planned load for the few critical key resources.
The S&OP&E is focused on the constraint that limits company Throughput (the rate at which your company makes money).
Short lead-times and near perfect
reliability can be a powerful tool for marketing. The knowledge which of the
company’s products use your limiting factor(s) most effectively can
help guide marketing and sales which products they should favour for greatest profit and profitability.
Market segmentation is a key job
for the marketing members of the team. Their job is to create segments that have significantly different prices (for the same physical item). Prices in one segment must have no impact on prices in other segments’.
Finance’s job will be to confirm that segments and their competitive prices
will contribute significantly to the bottom line. (If the company has excess
capacity – i.e. protective capacity ii should not be viewed as excess. Protective capacity is there to generate €s of Throughput, without the need to add operating expense.)
Other opportunities exist. For
instance, products that can be produced without consuming constraint capacity
(the internal limiting factor) are lucrative. If selling products that don't consume limiting factor capacity and they do not
create a new constraint then this can be a great tactic.
Exactly what a business should do
will depend on whether the company’s limiting factor is internal or external.
The S&OP&E is charged with challenging and recommending changes to policies and rules that damage company results.
Commonly held
assumptions about how a business should be managed leads to rules, policies,
key performance indicators or simply common practice (the way we work around
here). If the assumptions are faulty the business pays the price of lower Throughput and profits. An example of a damaging common practice is local optimisation. Every
department or business area is charged with improvement initiatives. Very often
these initiatives do not (properly) consider their impact on other parts of the
organisation (most critically, the limiting factor’s capability can be quite
severely damaged).
The S&OP&E's role is to seek out these damaging rules and to change them to eliminate
the damage. Care must be taken. Rules are usually there for a good reason. They
should not be simply eliminated (that can lead to chaos) but should be
carefully modified so that no collateral damage (especially to the constraint)
can occur.
The company (the senior management team, the CEO, etc.) commits to S&OP&E changes.
Actions (or recommended actions)
that an S&OP&E team will make are likely to be paradigm shifts
for all of management and employees on the (shop) floor. To cut production
lead-times (and work in process) by something like 50% is a paradigm shift and
for many not easy to understand immediately. This paradigm shift will be
coupled with shifting from local optimisation to optimisation at the limiting
factor – another change many will find difficult to swallow. The S&OP&E
team must not only determine what they want to change; the must also educate
the organisation (from the top to the bottom) why the change is essential, what will be
different, what the expected results will be and why there is practically no
risk involved.
Demand further into the future
will always be coupled with uncertainty. Nevertheless, capacity cannot be added
at the press of a button – there are lead-times to buy equipment and hire people. Senior management must
sign off on the preparatory tactics that will be implemented when demand trends indicate
growth sufficient to consume all available capacity.
From these 12 S&OP&E criteria it is
evident that I am proposing a powerful operating management team. The team 's objective is the integration of the various departments (finance, human resources, marketing, materials
management, operations, product management, and sales) into one powerful
coordinated unit that prevents damaging local optimisation.
The team will replace local optimisation with the appropriate focus to exploit the limiting factor in the best way and to cause the rest of the organisation to behave in support of the decisions how best to exploit the constraint. If we give the S&OP&E team this sort of cross functional power it is bound to be relevant to all team members and it will help achieve a much better bottom line.
I am grateful for any comments, upgrades. Please also point out any errors I may have introduced!
