Showing posts with label TOC. Show all posts

Tuesday, 3 January 2017

Impact of more than one Constraint - 5

Alan Barnard (at the 2006 TOC-ICO conference) asked the question whether the simple Throughput per Constraint Unit rule is valid with 2 (or more) overloaded resources. Alan used Eli Goldratt’s P-Q thought experiment for his discussion. His question is important because it is common to see businesses reduce ‘excess’ capacities to balance (or almost balance) capacities. The practice often results in two) or more concurrent constraints or ‘almost’ constraints. Since 2006 I have observed several factories that wonder why their output collapses below the theoretical capacity of their (almost) balanced lines.

I plan to show that that the Throughput per Constraint Unit rule continues to be valid using the same P-Q thought experiment. I also want to discuss this result in relation to the real World – how should companies manage resource capacities.

I would like readers to follow Eli Goldratt’s recommendation that they solve the problems – before I provide the solution and before my discussion of results. The learning experience will be greater and readers should be better able to discuss and critique my conclusions. If you are familiar with the thought experiment you can jump to the second part of this article.

The key part of the article comes at the end when the solution used in the P-Q thought experiment is discussed in relation to REALITY. The thought experiment should not lead managers to an easy solution. The tool is useful but requires thought and care.


Reality


As Eli Schragenheim[1] says, “The problem is not mathematical, the problem is the assumption reality is linear.” AND, a second problem is the assumption that “reality is deterministic”.


The real World is of course quite different from our thought experiment. In a real situation, customers will not allow their suppliers to dictate what they buy. Customers will not wait to buy Q because we want to make sure all the P demand has fulfilled (the original P-Q experiment). In reality we are unlikely to ever achieve the optimum. This is especially so when you consider that a business does not sell just 2 products, but more likely in the hundreds if not thousands of products. So forget about ever reaching the optimum.


BUT, is it still possible to move sales in the direction of better constraint utilisation?


In a real example, a business protects their engineering constraint by favouring the sale of standard products requiring no engineering. Their second favourite products are those that require only a small amount of engineering. Their annual sales have always been, and still are, limited by engineering. However, since their sales focus has changed the maximum possible annual sales have increased and, in turn, the business has become more profitable. Added sales are realised without the need for added to operating expenses. All that happened is sales of those items that do not need (much) of the constraint have increased significantly – without creating a new second (interactive) constraint.


Another example of using the Throughput per Constraint Unit as a tool to help decide what to sell is the Aramid fibre business (Kevlar®, Twaron®, Technora® are examples of brand names). A wide variety of aramids are produced with different structures and different fibre strengths (different decitex or weight per 10’000meters). Not only do many different varieties exist; aramids are also used in many different applications like sailcloth, ropes, filtration, tires, brakes, protective clothing (bullet proof vests) and more. Prices will vary from application to application and, of course, the price per unit of weight varies according to the decitex of the product. Since the various applications are so different, the sales and marketing organisation is divided into profit centres – each competing for supply. All this would be no problem until the factory is sold out and product must be allocated to customers.


A business can allocate fairly – give everyone the same relative amount less than they need; a difficult thing to do since clients catch on quickly and will order more to protect their business. The aramid supplier can also look at his product line and favour those products with the highest Throughput per Constraint Unit. (There is a fair chance that the most favourable or unfavourable products are not those with the highest or lowest margins.) He can also use the situation to target those customers that pay the lowest price in terms of Throughput per Constraint Unit and raise prices in those markets; higher prices tend to reduce demand or the client realises that, higher prices are justified.


The sales organisation needs to know the situation in relation to Throughput per Constraint Unit. They cannot switch away from clients and markets or raise prices as easily as I write this, but they can have a tool to help decide what they should do; where they should focus their sales and pricing efforts for greatest benefit.


Throughput per Constraint Unit is a tool to help decide what to do. Other considerations are part of the decision – including things like the importance of certain clients. When multiple profit centres are involved the tool can help resolve which of the profit centres should get preferential supply.


Eli Schragenheims work to develop a decision support system may well become the tool for business managers to use. (see footnote.)


Conclusions


  1. The simple Throughput per constraint unit does not always work, so be very careful (think carefully) when you believe you should be using it.
  2. The 5 focusing steps remain an excellent guide to manage a business. They do not absolve management from some critical thinking about how to approach initiatives to increase sales or to improvement operations.
  3. Many companies, by trying to balance capacity for cost reasons, will often leave a lot of money on the table. Judging how much money is left on the table is not an easy task. It is easier to decide to have just one constraint and to decide where the constraint should be. The lost sales, Throughput and profit due to balanced capacity can far outweigh the additional cost for just one constraint or even the additional cost to move the constraint into the market.
  4. Throughput and the impact of decisions on Throughput should take precedence over thinking about and taking actions to manage (reduce) inventories and/or cost. (A business is here to make money, not to save cost. If you want to save cost, do not start a business!) BTW – that Throughput should take precedence does not mean inventories and operating expense are unimportant.
  5. To think about what to sell (what to favour when selling) is a discussion that involves most of a business. Finance and controlling should lead the discussion. Sales and production are key participants. The managing director should probably also participate – after all some pretty key decisions will be proposed and made during such a discussion. To do this, scenarios must be built based on experience, knowledge and intuition about the constraining elements and the direction and opportunities in market demand. Such scenarios can be built and compared (see Eli Schragenheim’s work with his DSTOC software).
  6. So far the sales and operations planning process was not mentioned in the article; but this process, if it exists in the company, is a good place for such discussions. A good place as long as the appropriate participants are present, as S&OP design says they should be.


[1] Below are 3 article titles in relation to Eli Schragenheims thinking and his work in the area. They are found on his blog (https://elischragenheim.com/) that is well worth reading. Look for the following article titles: 1.) The Non-Linear Behavior of the Cost of Capacity; 2.) Is it really an opportunity? and 3.) The TOC Key Decisions Support (DSTOC).

Manicouagan Canoe Trip 16

After the portage around one of the waterfalls on the Manicougan River. ca. 1958 

Monday, 2 January 2017

Impact of more than one Constraint - 4


Alan Barnard (at the 2006 TOC-ICO conference) asked the question whether the simple Throughput per Constraint Unit rule is valid with 2 (or more) overloaded resources. Alan used Eli Goldratt’s P-Q thought experiment for his discussion. His question is important because it is common to see businesses reduce ‘excess’ capacities to balance (or almost balance) capacities. The practice often results in two) or more concurrent constraints or ‘almost’ constraints. Since 2006 I have observed several factories that wonder why their output collapses below the theoretical capacity of their (almost) balanced lines.

I plan to show that that the Throughput per Constraint Unit rule continues to be valid using the same P-Q thought experiment. I also want to discuss this result in relation to the real World – how should companies manage resource capacities.

I would like readers to follow Eli Goldratt’s recommendation that they solve the problems – before I provide the solution and before my discussion of results. The learning experience will be greater and readers should be better able to discuss and critique my conclusions. If you are familiar with the thought experiment you can jump to the second part of this article.

The key part of the article comes at the end when the solution used in the P-Q thought experiment is discussed in relation to REALITY. The thought experiment should not lead managers to an easy solution. The tool is useful but requires thought and care.

Interactive Constraints (like machines B and D in our example)

As we have just seen interactive constraints in my little PQ factory cut the maximum possible profit from 300€ per week to just 120€ per week (that is a 60% drop!). This is what interactive constraints can do to your business – they interfere with your capability to get the most from your most constraining resource.

Cost and efficiency pressures cause many business attempts to “balance” capacities – make all resources have about the same capability. This effectively introduces a second and potentially even more constraints into a production system. For most businesses, a collapse of capacity, is the surprising result – they cannot achieve even the original constraint’s capacity. Sales and profits are damaged. Not only do sales and profit suffer because current demand is not met; customers, because of poor delivery performance, leave for the competition, a much longer term loss and probably a much greater damage. 

To maximise profits and profitability most resources must have sufficient protective (or buffer) capacity so that capacity constraints cannot interact to damage the most constraining resource’s capability. Just one bottleneck is already one too many! Because, no matter what the supply chain does – when a demand spike occurs the company must either lose the added sales represented by the spike, or the company must promise delivery it cannot physically do. If a company promises what it cannot do, then the longer-term damage of lost clients will, sooner or later, happen.

To balance capacities is a ‘policy’ (or simply the way a company works). This ‘policy’ is a kind of (fake) constraint because the policy limits how much money the business can make. In such policy constraint cases; it is NOT this (fake) constraint the business must decide how to exploit (the 2nd step of the 5 focusing steps). The first step must be: change the faulty policy, including the faulty assumption that caused the business to balance capacities in the first place. Change the hidden assumption that resources are independent (operate in isolation) and therefore do not impact other (production) resources. A further assumption, not evident in the P-Q experiment is that resources are not subject to variability. Variability enhances negative effects caused by interactive constraints – if one breaks down the other constraints can easily be starved of work.

Observe this from the point of view of Lean and ask yourself this question: Does it make sense to reduce capacity/capability to balance capacity? Damaging your customers (because you cannot reliably supply) is a huge waste. Think about Lean as focused on maximising Throughput (and profit) and not focused first on minimising cost (waste). Consider lost Throughput as part of the waste you want to eliminate. The obstacle is managers do not view lost Throughput as waste. It is impossible for managers to put a “single definitive” number on Throughput waste – it’s an uncertain number dependent not only on what the company does, but also on client demand. On the other hand, cost ‘saved’ by firing a resource is a number you can easily determine – cost per person is in the ‘system’. (Never forget the impact firing a resource has elsewhere in your factory (because it can create interactive constraints). Also, remember how employees may react to the firing of their colleagues and friends to ‘balance’ capacities. How well will the remaining employees be motivated to help improve the business in the future?)

Observe this also from the point of view of Agile. We know that demand is uncertain, and often very uncertain at the article level. Ask yourself the question: Does it make sense to operate so close to capacity that any small spike in demand must be left to the competition to fulfil? Alternatively, does it make sense that we make promises to customers we cannot keep? To be agile means to be able to capture all demand our uncertain World sends our way. To do that we must be able to respond and capacity or capability is part of the answer.

Here is a second question: Does it make sense to keep a certain amount of protective capacity (“free” capacity) to be able to respond quickly? Protective capacity makes a company more agile, protects current Throughput and gives the business a better chance to gain new (more) Throughput.

You want your business to be Lean, but never anorexic. Lean means enough reserves to respond quickly and correctly to the changes our environment throws at it? Lean means having the stamina to win against your competitors. Anorexia will not do it.

This was some thoughts about interactive constraints and protective capacity. You may want to check out Eli Schragenheim’s blog for more about the importance of capacity buffers.


Manicouagan Canoe Trip 11

Manicouagan River Canoe Trip (1958?)  we slept under the canoes on that island … to avoid the black flies. The river is in Québec, islands like the one above are under water due to the Hydroelectric dams built since then.

Sunday, 1 January 2017

Impact of more than one Constraint -3

The P - Q thought experiment with 2 constraints


Alan Barnard (at the 2006 TOC-ICO conference) asked the question whether the simple Throughput per Constraint Unit rule is valid with 2 (or more) overloaded resources. Alan used Eli Goldratt’s P-Q thought experiment for his discussion. His question is important because it is common to see businesses reduce ‘excess’ capacities to balance (or almost balance) capacities. The practice often results in two) or more concurrent constraints or ‘almost’ constraints. Since 2006 I have observed several factories that wonder why their output collapses below the theoretical capacity of their (almost) balanced lines.

I plan to show that that the Throughput per Constraint Unit rule continues to be valid using the same P-Q thought experiment. I also want to discuss this result in relation to the real World – how should companies manage resource capacities.

I would like readers to follow Eli Goldratt’s recommendation that they solve the problems – before I provide the solution and before my discussion of results. The learning experience will be greater and readers should be better able to discuss and critique my conclusions. If you are familiar with the thought experiment you can jump to the second part of this article. 

The key part of the article comes at the end when the solution used in the P-Q thought experiment is discussed in relation to REALITY. The thought experiment should not lead managers to an easy solution. The tool is useful but requires thought and care.

Most of us ‘solve’ the problem without much thinking. It’s like a simple arithmetic problem from grade school. From groups we usually get quite number of ‘wrong’ answers – some from arithmetic mistakes, some from faulty thinking. Below you will find the answers from inadequate thinking and the explanation for the ‘right’ solution.

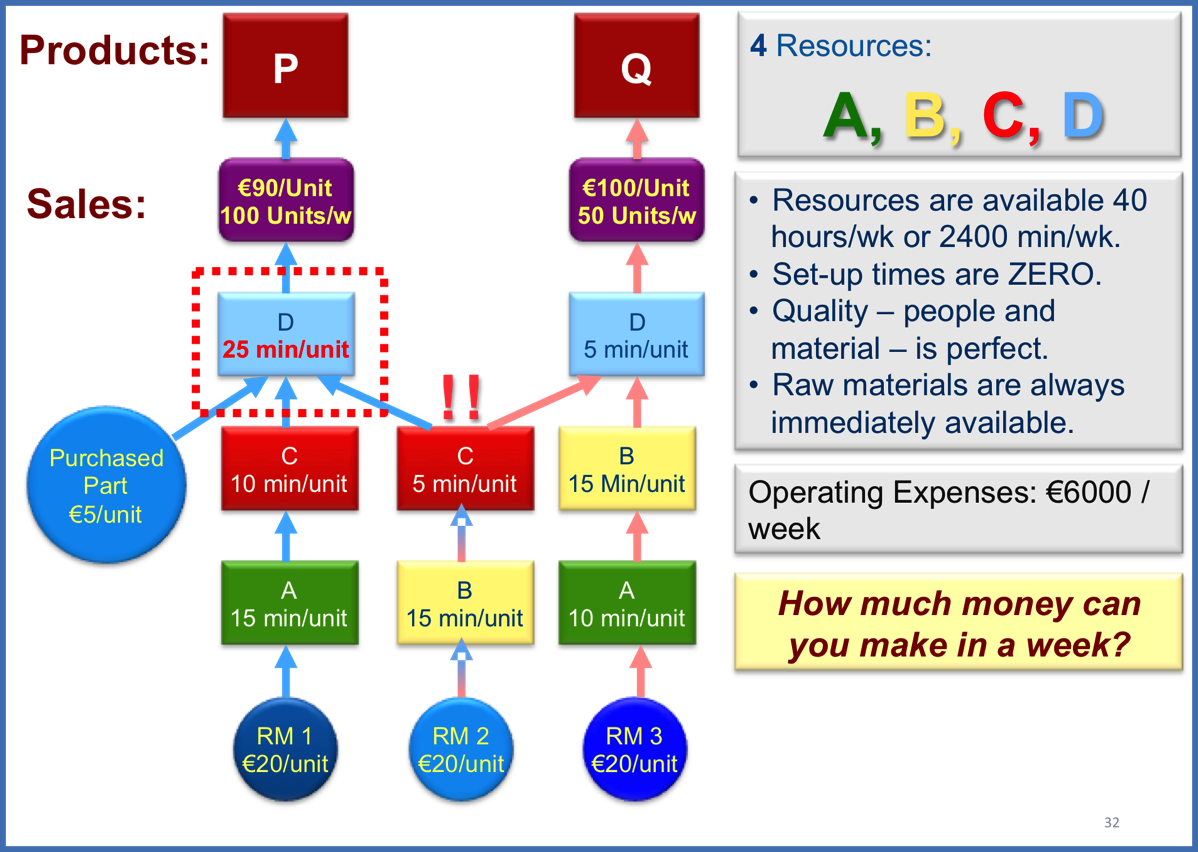
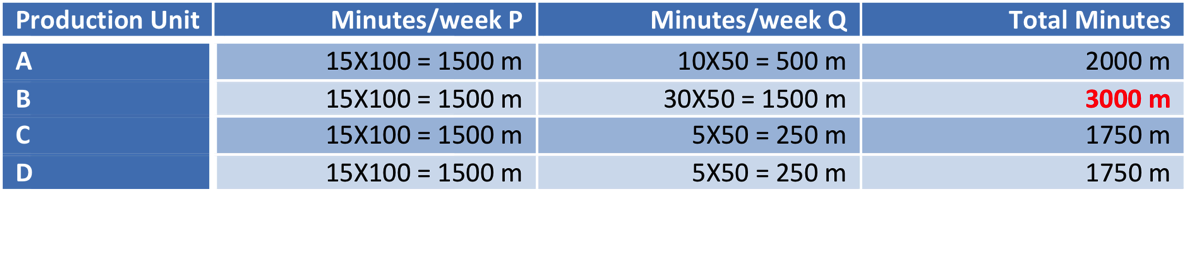
The only change in my little factory is the amount of time needed at D to produce 1 P. The time has increased from 15 to 25 minutes. Check it for yourself - both Band D machines have insufficient capacity to produce all the weekly demand.

NewImage


Below is the table showing how many minutes of each resource would be required to produce all the P and Q demand.


NewImage

Our simple rule to use Throughput per constraint unit is in difficulty – we have 2 constraints. But B is still the most constraining unit so lets try the rule. The table below shows the result.

NewImage

The rule does not seem to work. But we do have the more important rule that tells us to decide how to exploit the constraint (here we choose B, the more constraining resource). But to consume all the valuable B minutes we must have at least some D capacity available. So, we plan to sacrifice some P sales to liberate D capacity and make Q sales possible and to consume the primary (B) constraint’s capacity. B has 960 minutes of capacity available - enough to produce 32 Qs. To produce 32 Qs, I need 160 minutes; I must sacrifice 7 Ps.  BUT Sacrificing 7 Ps gives me 15 additional B minutes. I cannot use these to produce at the B machine (I need at least 30 minutes at B for 1 more Q).

Let’s sacrifice 8Ps and produce 36 Qs to consume all of B’s capacity – will our profits improve? Our secondary constraint (D) will still have 20 minutes of unused capacity after producing the 36 Qs.

NewImage


This looks good; but we still have 20 minutes of D capacity left with which we could produce up to 4 Qs. Lets produce just 1 more Q, which requires us to give up 2 Ps, but might increase profit.

NewImage

Not quite as good. 1 additional Q delivers 60€ more Throughput while giving up 2 of P costs 90€ Throughput – net we lose 30€ with every additional Q we produce. Not a good way to go. So lets try the other way – produce 1 more P.

NewImage

Also, not so good since we gain 45€ from 1 extra P but lose 60 from 1 less Q (net we lose 15€); AND we have 15 minutes of unexploited B left over. These 15 minutes would be enough for 1 added P. But by producing 1 P, we need 25 minutes of D capacity, which we no longer have. It looks like we have found the maximum profit possible, 120€/week.

By introducing a second constraint into the P-Q experiment the maximum possible is cut by more than 50%.

The rules to followed were

  1. Find the constraint (the most constraining resource).
  2. Decide how this resource is to be exploited.
  3. Subordinate everything else to that decision.

If we follow these 3 rules we should always find our way to the best mix to maximises our profit. (Alan Barnard used linear programming to find the same result.

In the next post I will discuss the impact of interactive constraints - like B and D are.


Cdn BaieComeau Oct 1955

Fall in the Canadian sub-arctic - near Baie Comeau Oct. 1955

Saturday, 31 December 2016

Impact of more than one Constraint -2

Solving the P – Q Experiment

Alan Barnard (at the 2006 TOC-ICO conference) asked the question whether the simple Throughput per Constraint Unit rule is valid with 2 (or more) overloaded resources. Alan used Eli Goldratt’s P-Q thought experiment for his discussion. His question is important because it is common to see businesses reduce ‘excess’ capacities to balance (or almost balance) capacities. The practice often results in two) or more concurrent constraints or ‘almost’ constraints. Since 2006 I have observed several factories that wonder why their output collapses below the theoretical capacity of their (almost) balanced lines.

I plan to show that that the Throughput per Constraint Unit rule continues to be valid using the same P-Q thought experiment. I also want to discuss this result in relation to the real World – how should companies manage resource capacities.

I would like readers to follow Eli Goldratt’s recommendation that they solve the problems – before I provide the solution and before my discussion of results. The learning experience will be greater and readers should be better able to discuss and critique my conclusions. If you are familiar with the thought experiment you can jump to the second part of this article.

The key part of the article comes at the end when the solution used in the P-Q thought experiment is discussed in relation to REALITY. The thought experiment should not lead managers to an easy solution. The tool is useful but requires thought and care.

Most of us ‘solve’ the problem without much thinking. It’s like a simple arithmetic problem from grade school. From groups we usually get quite number of ‘wrong’ answers – some from arithmetic mistakes, some from faulty thinking. Below you will find the answers from inadequate thinking and the explanation for the ‘right’ solution.

Attempt 1:

Many do not check whether or not my factory has sufficient capacity to produce all the Ps and Qs. They do not identify the constraint. These people, barring arithmetic errors come up with the answer shown below – 1500€ profit per week. That would be nice, but why would I ask a consultant for help? The constraint makes it impossible to earn 1500€.

NewImage

So, let’s find the “Find the constraint!”

The table below identifies it.

NewImage

Clearly the B machine cannot produce all of the necessary components for both P and Q. We need to decide how many Ps and how many Qs we can produce (the optimal mix) to maximise profit. B is the constraint and, in this case, also a bottleneck.

Attempt 2

Those that found the bottleneck usually ask things like ‘Can we buy another machine?’ or ‘Can we use overtime?’ For the purpose of the experiment no additional machine and no overtime is possible. The job is to maximise profit within the given parameters. To expand capacity by either overtime or adding a machine would mean we jump questions 2 and 3 of the 5 focusing steps.

Step 2 of the 5 steps is to decide how to exploit the constraint (our bottleneck). Most people, from high school students to CEOs, will check at least some of the following to see which product is the more profitable and should be favoured by the constraint:

  1. Which product has the higher price?  Q (100 vs. 90€ for P)
  2. Which product has the higher contribution margin (Throughput[1])?  Q (60 vs. 45€ for P)
  3. Which product requires the least amount of effort to produce it?  Q (50 vs. 60 minutes of effort per unit of P)

Based on these 3 checks it looks like Q is the better choice. Most people choose Q as the more profitable product. We should, therefore, produce all the Q (50) and fill our bottleneck’s capacity with P sales.

If we sell 50Q we consume 1500 minutes of B capacity (2, 15 minute operations multiplied by 50 units of Q). We have 900 minutes of B capacity left – enough to produce 60 P units. The table below shows our result.

NewImage

Not so good! Despite using commonly practiced checks for product profitability we generate a loss. Is this the best we can do? Might there a better way to decide what we should produce?

We did not apply the second of the 5 focusing steps correctly. The 3 checks we made had nothing to do with deciding how to exploit the bottleneck machine B. Maybe we should ask: How long does it take B to create 1 € of Throughput? How many minutes of B do each of our 2 products P & Q to require produce 1€ of Throughput?

  • Q Throughput is 60€ per unit. It takes 30 minutes to produce this Throughput. Producing Q our resource B delivers 2 Euros of Throughput every minute. It takes 30 sec. of B’s time to produce 1€.
  • P Throughput is 45€ per unit. It takes 15 minutes to produce these Euros. Producing P our resource B delivers 3 Euros every minute; it takes only 20 sec. to produce 1€ with P.

Shouldn’t our decision be to produce the product that delivers the greatest number of €s per unit of time available at B (the constraint; the limiting factor for Throughput)? (Alternatively shouldn’t the decision be to produce that product with which B delivers 1€ in the least amount of time?) If yes, then our decision must be to produce 100 P and 30 Q (100 P consume 1500min of B capacity, leaving 900min for Q. Since one Q requires 30min of B capacity only 30 can be produced). The table below shows the result.


NewImage

It looks like we have found a nice rule to determine what we should sell when a bottleneck exists. Throughput per constraint unit will tell us which product to favour – bearing in mind that our customers and our markets may not allow us to reach the theoretical maximum.

During Alan Barnard's presentation in 2006 he raised the question whether this nice simple rule (deciding based on Throughput per Constraint Unit) always works. He introduced a second constraint (at D) and asked how much we can produce now that two constraints are active at the same time. Is our simple rule still valid? If not, can we adapt the rule so that (sales) managers continue to have something simple on which to base their preferred product mix? The next post will show the P Q thought experiment modified for a second constraint at D.

Cdn Faehre Quebec Mai 1954

Chateau Frontenac, Québec City,  May 1954, 

[1] Throughput = the rate at which we make money = sales less totally variable cost (usually just materials).

Friday, 30 December 2016

Impact of more than one Constraint -1

Alan Barnard (at the 2006 TOC-ICO conference) asked the question whether the simple Throughput per Constraint Unit rule is valid with 2 (or more) overloaded resources. Alan used Eli Goldratt’s P-Q thought experiment for his discussion. His question is important because it is common to see businesses reduce ‘excess’ capacities to balance (or almost balance) capacities. The practice often results in two) or more concurrent constraints or ‘almost’ constraints. Since 2006 I have observed several factories that wonder why their output collapses below the theoretical capacity of their (almost) balanced lines.

I plan to show that that the Throughput per Constraint Unit rule continues to be valid using the same P-Q thought experiment. I also want to discuss this result in relation to the real World – how should companies manage resource capacities.

I would like readers to follow Eli Goldratt’s recommendation that they solve the problems – before I provide the solution and before my discussion of results. The learning experience will be greater and readers should be better able to discuss and critique my conclusions. If you are familiar with the thought experiment you can jump to the second part of this article.

The key part of the article comes at the end when the solution used in the P-Q thought experiment is discussed in relation to REALITY. The thought experiment should not lead managers to an easy solution. The tool is useful but requires thought and care.


The original P-Q Experiment


Goldratt frequently used this experiment as part of his presentations. Before introducing the thought experiment he would usually present and discuss his 5 focusing steps listed here:


  1. Identify the constraint of the system.
  2. Decide how to exploit the constraint.
  3. Subordinate everything else to the above decision.
  4. If you cannot extract any more from the constraint, elevate (expand) it.
  5. If during any of the previous steps the constraint is broken (has moved to another location) go back to step 1. BUT do not let your inertia become the systems constraint!


The P-Q Company


The company is mine. I have hired you to help me maximise my profits from the resources I have.


  1. I have 4 machines (A, B, C and D). All 4 are required to produce my 2 products P and Q.
  2. There are 40 hours of production time available per week (1 shift). (40 hours are 2400 minutes.)
  3. Product P sells for 90€ per unit and Q for 100€ per unit.
  4. Demand per week is 100 of P and 50 of Q – if my factory can make all 150 units.
  5. Raw materials 1 and 2 plus a purchased part are required to produce P (1 of each raw material and purchased part).
  6. Raw materials 2 and 3 (no purchased parts) are required to produce Q (1 of each).
  7. All raw materials cost 20€ per unit. The purchased part costs 5€/unit.
  8. Operating expenses (all costs other than materials and the purchased part) are 6000€ per week.
  9. Raw materials and purchased parts are always immediately available.
  10. All set-up times are ‘one-touch’ – set-ups take no time at all.
  11. All resources are perfect – all work 8 hours per day without any breaks, even my people work 8 hours without fail.
  12. Quality is perfect; I experience no losses due to defective parts or products.
  13. The graphic below shows the routing (how materials flow through my factory from raw material to finished product). The routing shows the sequence of operations each product goes through and not the layout of the factory. Clearly raw material 2 is required for both P and Q as are the operations on the B and C machines in the middle path.
  14. How much money can I make per week?
NewImage


Work it out – the answer can be found using what has been written so far, or you might want to use linear programming. Either way, try to understand why you decided on one or the other option to produce and sell. When you are finished, carry on to the next page.


A solution to the problem is demonstrated starting on the next page or in my next post.

Cdn BaieComeau Feb 1954

Winter in Baie Comeau - Feb. 1954!!!

Sunday, 3 April 2016

The CEO’s Mission; The CEO’s Concerns

The CEO’s mission is to make sure his enterprise is ever flourishing. The criterion for ever-flourishing companies is to grow and be profitable far into the future, to always satisfy their customers and, achieve and maintain both satisfying and secure jobs for their employees.

The CEO mission is easy to define but it is an extremely challenging target. What should CEOs concern themselves with in order to achieve this very ambitious target?

Make Money Now and More in the Future

What is the key factor that blocks a CEO’s business from making more money? What might the core problem be that leads a newspaper like the Guardian to write t

The Guardian

hat senior executive remuneration is absurdly high and that many of those chosen for top jobs are ‘mediocre’?

A lack of intelligence cannot be the core problem – almost all senior executives are very smart. Their results or their performance may be mediocre, but intelligence, they do not lack. So, what blocks their performance, and what blocks their companies from achieving more of their targets? 

What is a CEO’s mission?

Whatever vision, mission or goal an organisation (a business) has, it cannot pursue it without sufficient money. Cash flow, profit and return on investment now and more in the future are essential for any enterprise to flourish. It is obvious this necessary condition must be fulfilled, along with satisfying customers and ensuring satisfying and secure jobs for employees. What is not so easy is to fulfil are all three necessary conditions at the same time, forever. To fulfil them is, however, the mission of every CEO and his management team.

Initially my focus will be on the first necessary condition for success – to ensure growing cash flow, profit and return on investment. (If a CEO can generate enough cash flow, profit and ROI, without alienating his team, he will have the means to pursue the other two necessary conditions.) To focus on the bottom line a CEO must first be dissatisfied with his company’s current levels of cash flow, profit and return on investment (independent of the glowing reports found in the annual report).     

What blocks Businesses from making more Money?

(Now and in the Future)

The core of this CEO problem and for almost all businesses is an, apparently, wrong assumption about what a business is. On the one hand all managers know that a business is a system of interdependent departments, divisions and groups. On the other hand many policies, reports and key performance indicators (KPIs) are aimed at one department or division at a time; most policies, reports and KPIs focus on the decisions and actions of one or at best just a few departments. The way a business is managed is therefore at the local level; as though departments and divisions are independent of each other – the actions of one, it is implicitly assumed, does not affect the performance of another. Every manager and department is asked to focus on his local environment to improve it. Local optimisation is the rule; global optimisation, unfortunately, is not.

Compromise

The World is not quite so black and white. Most business is managed by some sort of a compromise – a bit of global optimisation and a bit of local optimisation. I believe local optimisation is, in fact, the way most businesses operate most of the time. Are such compromises the right way to operate? What is the cost of compromise to the bottom line? To begin to find out the cost of these compromises, what does the dilemma or conflict, the reason for compromise, actually look like? 

It is probably safe to assume that CEOs, and his managers, want to lead their company to become an ever flourishing one, now and even more so in the future.

To achieve this the CEO needs, on the one hand, a set of simple policies and key performance indicators (KPIs) to guide all levels of managers and employees to make good decisions for their division, department or area – the manager’s area or responsibility and expertise. These departments must be competent effective and efficient in what they do – be it production, research and development, sales or any other function. The CEO needs departments that all do an excellent job in their area of responsibility – he expects them to optimise locally. This side of the conflict is usually managers’ focus. 

On the other hand departments are interdependent. To deliver the desired bottom line result they must work together in an aligned and coordinated way. It is very easy for any department to take a decision that on the surface seems to make a lot of sense but, when the decided action is taken, damage to another department’s performance is the consequence. Whenever this happens the company’s bottom line is at risk – actually the bottom line usually suffers. Instead the CEO needs all departments to optimise in a way that does not damage those few factors (production capacity, or market demand for the company’s products, …) that limit the bottom line. The CEO not only needs his department managers to keep the bottom line in mind, but he needs them to act in a way that optimizes the bottom line. He needs his department managers to be an integral part of the company’s global optimization.

Departments should therefore optimize both locally and globally, at the same time. To do this will certainly trigger conflicts within and between departments depending on how each individual department or division is measured.  On the surface it’s an easy decision to optimize globally – the rule would be to, “always do what is good for the company as a whole”. Under the surface, within all the departments, the situation is as clear as mud! How can a manager somewhere within the company have enough knowledge and insight into the workings of the company to always be in a position to take the right decision? ERP systems may have the necessary data within them; the necessary information is not generated and does not reach the managers that need it.

The following diagram describes the conflict:

CEO Conflict

 As described above both needs are valid; for the company it is important that both are fulfilled.

The wants are in conflict. It is apparent both wants cannot easily be achieved concurrently. The Wants are in conflict but that should not be the situation because both the Wants are there to fulfil an important valid need.


What are my assumptions for the reasons the two Wants are in conflict? There are several and you may find more:

  1. Very often top management’s KPIs are in conflict with local department or divisional KPIs.
  2. In most companies managers at the local level do not have the necessary information to be able to make the right decisions for the company as a whole. Usually the information available to them is only about their immediate environment.
  3. ERP systems, despite the huge amounts of data they contain, do not supply the necessary information for managers at all levels to take the right decisions for the company as a whole.
  4. In many companies policies, rules, culture and organisation structures exist that lead to conflict situations between departments.

These 4 are possible explanations for the CEO’s problem (or conflict) over global vs. local optimisation. 4 Examples may illustrate the situation better.

1.     Top management’s KPIs are in conflict with local KPIs:

Top management KPIs are things like cash flow, profit, ROI coupled with things like the per cent of sales and profit that comes from the last 3 years’ new product introductions. On the other hand at the local level departments like R&D or production have efficiency or cost reduction KPIs. Efficiency or cost KPIs will usually cause managers to make sure all    resources are all working productively. The consequence of efficiency as a goal is often factory overload (very high work-in-process levels) leading to both high inventory levels and shortages (because switching between products lowers efficiency) and ultimately damage to CEO KPIs. Inventory levels, profits, cash flow and return on investment are all impacted negatively.

In R&D the need for efficiency causes managers to launch too many projects in an effort to keep everyone busy (and ‘effective’). The consequence, as shown by Little’s law, is both a loss of capacity and of speed. Both losses impact hurt the CEO’s bottom line.

Leadtime  Capacity

The graphic to the right illustrates the situation. Many (most) companies operate in the pink ‘common practice’ area and suffer the consequences in longer lead-times, reduced capacity and as a result of these 2 effects poor due date performance. The problem stems from KPIs, like efficiency, which cause departments[1] to overload their resources as the graphic shows.

The impact of lost sales due to overloading production can be enormous. By moving from too much WIP to the sweet spot a company can produce additional volumes without adding any cost. If this added production could be sold the impact to the bottom line is sales less (just) materials cost – a major incremental benefit. Just 10% more sales increases a 6% bottom line to about 11% (assuming materials are 50% of sales). This is huge!

It is part of the CEOs mission to make sure local KPIs (that he and his management team set or agree to) do not damage his (and the company’s) KPIs!

2.     Local Managers do not have access to the Right Information!

Aramid fibres are used in many applications from tire reinforcement, to reinforcement for optical glass fibres, to sailcloth, ropes, filtration and more applications. Fibres such as Aramids are produced in many different fibre diameters (the unit of measure is decitex – the grams of fibre per 10’000m). In the factory the limitation in terms of kilos produced depends either on the flow of polymer or the flow of fibre in the spinning process.

In the businesses concerned each application is a profit centre and all of them compete for product from the same factory. All have different profit margins based on calculated production costs and the market prices. If the factory is sold out –all of the profit centres will fight to get enough to meet their demand and fulfil their forecasts. But which of the profit centres should be favoured in order to maximise the overall business profit?

Should the fine decitex products that have much higher margins vs. the heavy decitex products be favoured? Is the profit margin the right criterion? If not, what is, and do the profit centres get the appropriate right guidance?

In this case all the managers have are profit margin and contribution (sales less materials cost) margins. But, when the factory is sold out, this is not enough. They need to know how effectively, in terms of the bottom line, the factory’s capacity is used; they need the contribution per machine hour (or, possibly, factory hour). This is the absolute margin earned by a product (or sale) per hour of the constraint machine (or factory). A fine decitex takes a long time to earn its margin while a heavy one earns it quickly. Without this sort of information the profit centres are likely to make the (common) error of preferentially selling the apparently high margin product that actually delivers less to the bottom line.

For the CEO to fulfil his mission he must make sure profit centres have the right information at the right time (a factory is not usually sold out all the time). His profit centre managers must be in the position to maximise the Throughput (the same as contribution used above) of the constraining element (for the company as a whole). To do this he needs those people with the capability to develop the necessary KPIs that truly align every profit centre with a CEO’s bottom line targets.

The example talks to the need for sales to sell the right products to maximise Throughput. There are other situations that need proper clarification and better information for managers to take the right decisions.

In many (most?) instances managers of a department have no choice but to optimise locally; they simply do not have the necessary information and decision rules to operate any differently.

(Industry 4.0 is coming. Will it solve this problem? The potential exists but a big part of making Industry 4.0 a success is the necessary change to management practice.)

3.     ERP systems are no help; but they could be!

There are many examples of situations such as that described in the section above. The data necessary to generate the required information for the right decisions exists, to a large extent, within ERP systems. The necessary information could be made available but generally common practice prevents its generation. Is the view is not worth the climb? The example about misaligned KPIs should be powerful enough to at least indicate to CEOs that the potential is or can be huge. CEOs have the power to cause the necessary upgrades to their ERP systems and make the right information available for all those managers and employees that could make good use of it.

Employees will be a problem. For so long, their only option has been to optimise locally. They probably have (very) little aptitude and knowledge how to think about the company as a whole – let alone evaluate their local action’s impact on the company. Whenever I ask a manager about another part of the company I get either no answer or some sort of wild guess. Its very much like most of the World’s population that, despite the best efforts of the BBC, CNN and others, has no idea what its really like to live and work in other countries. The CEO’s job will be to get everyone into the new mind-set (or new paradigm); one that requires all of us to understand our roles for and our impacts on the company as a whole.

The concepts are not difficult to grasp – they are (just) common sense. Nevertheless managers at all levels will need coaching to get them over the hump so that they can always decide in favour of the company. Inertia is the barrier to rapid and sustainable change because once something is learned it becomes a paradigm and is then difficult to shift. Old paradigms must be shifted and not just by a little bit. CEO’s have it in their power to cause paradigm shifts – by leading the change together with their C-level colleagues. The C-level team’s leadership is key for the necessary change.

4.     Assumptions, Policies, Rules, KPIs, Culture, Structure

A CEO arrives in his job with experience, knowledge, a set of assumptions, and paradigms he acquired in his previous jobs. All of these are obstacles to change because paradigms are generally not questioned – there is simply not enough time in a day or month to question them all since a CEO has so many things that concern him. He is bombarded with problems and decisions from both internal and external sources – not to mention the various official duties he may have. A CEO solves, somehow, conflicts such as what products should be sold – to optimise production or to generate the highest sales volumes and margins. Often such problems are solved with a (less than optimal) compromise because both departments get half a win. In the end nobody is truly satisfied.

If a CEO solves such a problem in the way just described he is likely following an assumption about the importance of maintaining motivation; although I wonder how motivating such compromises really are since ‘in the end neither department can be satisfied’.

The important word is assumption. Based on what he knows the CEO has a collection of assumptions (or paradigms) that determine how he will behave. His paradigms are the necessary shortcut essential for him to manage given the stresses and volume of work he faces. Without them his job would, for time reasons, be impossible. With paradigms, especially if their validities are not questioned, his mission is just as impossible to achieve because many paradigms, if not wrong, are inadequate for his job. He cannot achieve his mission.

On his own a CEO cannot develop the appropriate policies and KPIs – he is too busy. He needs someone that understands the need for and how to get global optimisation. He must give this person the freedom and necessary time to craft both the new policies and the related KPIs. The management team and the company as a whole must review these KPIs – do they really support the company as a whole; do they give the correct guidance to all departments? Everyone should have the possibility to input from their different perspectives in order to test the new policies that should guide the company to optimise globally, and leave local department optimisation behind.

Products and Services are “Created Equal”

What our competitors and our company offer to customers is all about the same. In most cases not one of the competitors in our industry has a sufficient enough competitive advantage to gain market share or to realise better prices. All of us suffer declining prices as our customers take advantage of this situation. We all have no choice but to match ever-lower prices in order to maintain market share and contribution to our bottom line. More and more our focus is cost and efficiency. We are forced to reduce cost to survive with ever-thinner margins. More and more our ability to invest in the future through better (production) equipment and new products is compromised. Without a miracle we may soon be out of business.

This sounds dire. It is probably the truth in more industries than we think. Look at Apple and Samsung smartphones. Are they, in reality, much different one from the other? For the average user it probably makes no practical difference which smartphone he or she has. For most other industries the differences between products is probably even smaller than this example. Product differentiation is often not the key factor to gain market share. In most industries, if a product differentiation is achieved, competitors will almost always catch up very quickly.

How can your company achieve a decisive or (even better) several decisive competitive advantages so that your (the CEO) can achieve his mission – a truly ever-flourishing business? The answer must come from effectiveness, speed and reliability from the company’s key departments.

Finance, Key Performance Indicators and Policies

Cost Reduction

A consequence of the described situation is pressure on cost (by Finance). Clearly every bit of cost we can eliminate from our operating expenses will help improve the bottom line. True, if the cost reduction does not cause Throughput[2] (or sales) to decline. If Throughput declines the effect of a cost reduction can easily be negative – for every sale lost the corresponding Throughput (or contribution margin) will be lost from the bottom line. (A 5% turnover loss wipes out a 5% cost reduction for a typical company.)

Common practice favours cost reduction over the possible (but uncertain) impact on sales and Throughput. Maybe this is because we can define exactly the cost to be reduced (the advertising we stop, the people we fire etc.) while it is very difficult to predict the impact on sales and the reasons for this sales impact. Nevertheless Throughput is very real and somebody must make the judgement call of any decisions impact on Throughput and therefore on the bottom line.

We recommend companies to look at a contemplated decision’s impact in absolute numbers – sales, Throughput, operating expenses and profit. The CEO’s role and responsibility is to make sure Finance and the company’s managers evaluate their decisions based on the effect on Throughput, Operating Expenses and Investment, not just the impact on one department! Following this recommendation will tend to help a company maintain and even increase market share. It will help the company focus more on those things that do increase sales and market share. It does not diminish the importance of cost; it does increase the importance of Throughput and Inventory relative to cost.

Efficiency

All managers want to apply their resources efficiently. “A resource standing idle is a major waste”; so managers will try to make sure everyone is busy working on something (at least apparently) useful. Concurrently all employees will want to be busy – after all they are as aware of cost pressures as managers. If employees are not busy (not seen to be busy) then they feel their jobs are no longer secure.

The damaging consequence of everyone and every machine working “all of the time” is factories to fill up with work in process that will slow the production process down, make the factory unreliable and deteriorate quality. The chaos that reigns on the shop floor reduces a factory’s capacity and correspondingly increases unit costs – especially as sales are lost due to longer lead-times and greater unreliability.

The CEO’s role is to make sure work in process is never above the optimal range that ensures lead-times are low, production can deliver reliably on time and capacity is maximised. If a CEO is able to do this, his company will eventually gain sales and market share with little or no added cost. Share gains have the added benefit of weakening the competition. Good reliability and shorter lead-times also will result in less price pressure from the market. This advice (ensure the optimal level of work in process[3]) holds true for all areas of a business – not just production.

Efficiency is often measured based on tons/hour (steel); square meters per hour (films, paper; units per hour etc.) or, in the case of sales, the number of calls sales people make. In the good old days of X-Ray film production factories produced film large enough to X-Ray an entire thorax as well as tiny films for dentists to X-Ray your teeth. Factories measured production efficiency by the number of m2 produced in a shift. Since film for dentists was (is) inefficient to produce, production supervisors would postpone dentistry film for the next shift or until someone started yelling very loudly! In steel factories thick steel plate is much more ‘efficient’ to produce (in tons/hour) than thin plates – so there is usually a surplus of thick and shortages of thin plates.

The CEO’s role is to make sure the load on a factory is limited to a maximum amount where production capability and lead-times are optimal, and there should be no more in stock than required for the near future. Production must not steal capacity from one product in order to produce too much of another. To produce more than immediately necessary might improve efficiency numbers, but it often steals capacity required for (much) more urgent and real demand.

Efficiency is important but only if sales and Throughput are not blocked and only at the constraint – the factor that limits the businesses capability to produce Throughput. If a business has plenty of production capacity, then it may be that the efficiency of the sales organisation should be improved. How can more orders and market share be gained? Sometimes (often?) sales people are hampered in their efforts by the factory’s drive for efficiency!  If a factory’s delivery performance in terms of lead-time and due date reliability is poor, no wonder sales have a hard time convincing customers to buy. Conversely, if all competitors’ performance is equally poor, then the one company that improves lead-time and due date performance significantly will almost certainly emerge as a winner. This company’s sales and margins will improve, at least until competitors catch up.

Engines of Disharmony

While I hope that all of the above might make sense to you, a lot of it is the opposite of common practice. In fact it is often the opposite of what managers and employees think is expected of them. In today’s business World there are constant pressures to improve – efficiencies must increase, costs must decline, inventories must be minimized, due date performance should be perfect and lead-times short. Almost everyone sees the conflicts between the first two (efficiency and cost) and the rest. People have no choice but to compromise. The 3 quotations in the box above indicate what many smart people think about the value of compromises.

In fact these diverging pressures lead to Goldratt’s  “engines of disharmony”. These “engines” are:

  1. Not knowing my own required contribution to the goal or how my contribution will be measured and recognized.
  2. Not knowing others’ contribution or how their contribution should be measured and recognized.
  3. Organizational conflicts about which “rules” to use to best achieve organizational goal(s).
  4. Individual conflicts due to unresolved gaps between responsibility and authority (e.g. resulting in firefighting).
  5. Inertia or the fear of failure blocks necessary changes to achieve ongoing improvement.

Lets assume a manager (CEO) decides to implement the suggestions from above. Unless the reasons for the change are explained very well these engines are likely to be active and prevent the desired progress. If old rules are not modified correctly then despite good explanations the engines will be active – especially if many ‘old’ rules support the efficiency syndrome and pressures on cost. The rules need to change so that Throughput becomes the top priority (without making inventories and cost unimportant) not some unsatisfactory compromise between sales increases and cost reduction.

The engines of harmony the CEO and his company need to achieve are:

  1. Employees know exactly how they should contribute and how their contribution will be measured and recognized.
  2. Employees know exactly how others should contribute and how others’ contribution will be measured and recognized.
  3. Systematically align “rules” with goal of the organization (replacing local/short term optima with global optima rules).
  4. Systematically close gaps between responsibility and authority, using “firefighting conflicts” to trigger improvements.
  5. Processes, skills and culture are improved continuously by exposing inconsistencies and challenging basic assumptions.

To create harmony in an organization will require a considerable amount of thought by the CEO and his management team. Changes such as those suggested will cause uncertainty and resistance. Employees will evaluate management’s actions In relation to their experience and their personal criteria. Resistance to the changes can be expected. This resistance is caused by employees’ evaluations about the proposed changes – including all the misunderstandings, all the experience they have from the past and how they evaluate the proposed changes in relation to their person (“what is in it for me”). To prepare for the change management might look at the situation from the 4 quadrants of (resistance to) change.

  1. The pot of gold” symbolizes the expected benefit (for everyone involved) the CEO and management see from the proposed change. (The company will become much more profitable with positive consequences for both employees and customers.)
  2. The crutches” symbolize the potential damage that may be the consequence of the proposed change.
  3. The mermaid” symbolizes what employees like about the current situation – it might simply be that they know exactly what to do in their job and as a result they are comfortable and do not want to change.
  4. The crocodile” symbolizes the consequences of not making the proposed change. If we do not make the changes then competition will … (All major automobile manufacturers see Tesla electric cars as a crocodile and consequently are developing their own electric cars.)

These four perspectives of a change are important in order to build acceptance throughout the company. The ‘inventor’ of the change (the CEO) is likely to be focused on the pot of gold and may ignore the other quadrants – except as they relate to him. The CEO must not forget that his managers and employees also have 4 perceptions of the change and these perceptions will not necessarily be the same as his.

Summary

Major opportunities exist for CEOs to fulfil their mission. Current common practice tends to block companies from realising this potential. CEOs and their managers need to move away from efficiency and cost focus everywhere, to a strong focus on Throughput first. If they do they will soon realise the powerful effect gaining Throughput can haves on their bottom line (not to forget the impact on cost and efficiency!).

Not only are their opportunities for CEOs to achieve their mission, tools exist to help them think about and design their successful change strategy and implementation tactics. The tools are useful frameworks to think about the many consequences and how both customers and employees will perceive them.

CEOs and companies that successfully implement the suggested changes should expected significant jumps in performance – not just a few percentage points, but double digit ones. (When implementing their change a CEO and his employees should record their expected outcomes, check their results against these and take appropriate action as a result of any deviation(s))


[1] We mentioned production and R&D, however, the effect of too much work in process causes the same damage in other departments – sales often chases too many ‘skirts’ (potential customers) and, due to too much WIP, misses out with too many opportunities.

[2] Throughput = the rate at which we make money or Sales less Totally Variable Costs (usually just materials). Many times Throughput is called contribution margin. We use Throughput because contribution margin, can an often is, defined differently.

[3] The optimal level of work in process (WIP) cannot be determined deterministically – there are too many variables and too much uncertainty. Happily the peak area is relatively flat so a good enough guess at the level of WIP is the way to go. Just do not starve your resources with too little work. The risk of too little work for resources is small since a) only the constraint should be close to a full load and b) the efficiency paradigm will not disappear easily.


Technorati Tags: , , , , , , , , , , , , , , ,

Sunday, 19 April 2015

On Clear days you can see Corporate HQ 12

Why the 5 Focusing Steps are so Important

Most middle and senior managers do not understand or simply are not interested in how their business system works. They are content to focus on their local department and optimise that – rather than understanding the business as a whole to cause it to maximise results. Even top management (CEOs) often do not understand their business. They condone and even encourage their management teams to optimise their local departments – production, marketing sales, finance etc. Wherever local optimisation is the rule the business concerned will always harm the bottom line significantly. Local optimisation is a massive mistake!

The 5 Focusing Steps are guidelines that, properly used, will cause a management team to always reflect on their (local) decisions. Doe the action or decision taken locally help or damage the business as a whole? As we will see the 5 Focusing Steps are a guide, but they do not replace a deep understanding of the business system.

What follows is my fifth example of the impact of the exploit and subordinate steps on the bottom line. In this example I have chosen a situation in which top management has sent a directive to all factories to increase yields (reduce scrap rates). The factory managers’ bonus would depend on achieving the 3% improvement target. Just a small policy change would be worth a huge amount.

BTW. If you have any similar examples please share them with me. I will publish them (if there are not too many!) Send your stories to CSSTW@Bluewin.ch - I will credit you with the story.

5th Example of the 5 Focusing Steps in Action

Yield Increase or Scrap Reduction Targets

Every once in a while senior management comes up with a great idea. In this case the COO came up with the directive that all factories must increase yields by 3% (or reduce scrap rates by that amount). The directive was sent to all factories around the World. On the face of it a good idea.


Production management at one of the factories were convinced that their machines, very large machines, would not allow them to achieve their 3% improvement target. They made 3 standard colours in high quantities and a number of the colours of the rainbow in small quantities. The 3 major colours were no problem, yields were already excellent there - actually the problem was that no significant improvement was possible. These small quantities of colours suffer from poor yields (high scrap rates) because change-overs for small quantities on large machines consume a lot of material to be sure the colour from the previous lot has been fully flushed from the system.  The required quantities of pigmented products is not very high so that changeover material losses were a high percentage of production batches. The situation could also not be improved with their existing equipment - cleaning by dilution takes a lot of material.

The factory solved their problem by outsourcing pigmented production to suppliers that have smaller machines. They met their yield targets but as a consequence had quite long periods of no production on their big machines when they would normally be producing colours and, of course, they had to pay considerable fees for the outsourced production.

After a year the business manager was transferred elsewhere. The new manager saw the damage caused by the outsourcing. What he saw was an annual net penalty if 1.5 million$ (the cost of outsourcing far outweighed the value of any yield gains).

Here we have another example of a damaging corporate policy that should have never been implemented in the factory concerned … and possibly also elsewhere. Improved yields are a good target to set but should be done with full knowledge of any consequences. In fact senior managers (COOs) should allow (in fact expect) their managers to raise such potential negative outcomes of an action. If they did allow/expect such reactions, then many businesses might be better off.
BaieComeau Ruedi Susi August 1953 01

Monday, 6 April 2015

On Clear days you can see Corporate HQ - 10

Why the 5 Focusing Steps are so Important

Most middle and senior managers do not understand or simply are not interested in how their business system works. They are content to focus on their local department and optimise that – rather than understanding the business as a whole to cause it to maximise results. Even top management (CEOs) often do not understand their business. They condone and even encourage their management teams to optimise their local departments – production, marketing sales, finance etc. Wherever local optimisation is the rule the business concerned will always harm the bottom line significantly. Local optimisation is a massive mistake!

The 5 Focusing Steps are guidelines that, properly used, will cause a management team to always reflect on their (local) decisions. Doe the action or decision taken locally help or damage the business as a whole? As we will see the 5 Focusing Steps are a guide, but they do not replace a deep understanding of the business system.

What follows is my third example of the impact of the exploit and subordinate steps on the bottom line. In this example I have chosen a situation in which there is a constraint only during a part of the year - that could be overcome through inventory management. Just a small policy change would be worth a huge amount.

BTW. If you have any similar examples please share them with me. I will publish them (if there are not too many!) Send your stories to CSSTW@Bluewin.ch - I will credit you with the story.

3rd Example of the 5 Focusing Steps in Action

Year-end Low Inventory Targets

Such targets are policies instituted to demonstrate a well-managed business with low inventories to Wall Street and investment analysts. Factory and business managers are given no choice but to meet these year-end targets no matter the problems it gave the business.
One business always met its targets with the full knowledge that as soon a January starts they would not be able to fulfil market demand. Because they could not deliver everything early in the year they were later forced to lower prices in order to win back the lost business. Year-end inventory targets were extremely damaging to their bottom line. A 1% price reduction cuts a 10% margin by 10% to 9%. Can you imagine that 1% is enough price incentive to win back customers?
0T2 5 Steps
Another business, also with a stringent year-end inventory target, sold synthetic yarns to a special industry that created fabrics for the consumer market. The nature of this business was such that during the first quarter of every 2 years out of 3, demand would exceed supply by a considerable amount. Since year-end inventory targets were holy, factory management did not dare to produce for the first quarter. Instead the produced enough for the first quarter but sold the extra amount (above inventory targets) to dealers at very low prices – at least this way their customers would be satisfied – they get the quantities they need from their factory  and not from competitors. 
Calculate for yourself what the cost would be to hold the extra inventory for on average 5 months 2 years out of 3 and say 8 months in years without peak demand. The cost of holding the extra materials is minimal compared to the extra income (Throughput). The extra income is sales less materials cost.
Factory management was most irritated by this because the dealers owned Aston Martins and Ferraris while they (factory management) could only afford Fords!
Clearly, when you read these 2 examples the conclusion has to be that the policy concerned is not a good one. Low inventories are certainly a good idea, but only once you can continue to meet demand despite low stock levels. Corporate management is the problem. What they want is fine, but it should not be requested equally from all factories. A further problem is it is very difficult to get sufficient time with top managers (either because these are too busy or middle managers fear for their careers) to show that the local optimisation of inventory leads (in such cases) to bottom line damage. Such situations often live on for many years damaging the company year after year.

IMG 0574

Sunday, 5 April 2015

On Clear Days you can see Corporate HQ - 9

Why the 5 Focusing Steps are so Important

Most middle and senior managers do not understand or simply are not interested in how their business system works. They are content to focus on their local department and optimise that – rather than understanding the business as a whole to cause it to maximise results. Even top management (CEOs) often do not understand their business. They condone and even encourage their management teams to optimise their local departments – production, marketing sales, finance etc. Wherever local optimisation is the rule the business concerned will always harm the bottom line significantly. Local optimisation is a massive mistake!

The 5 Focusing Steps are guidelines that, properly used, will cause a management team to always reflect on their (local) decisions. Doe the action or decision taken locally help or damage the business as a whole? As we will see the 5 Focusing Steps are a guide, but they do not replace a deep understanding of the business system.

What follows is my second example of the impact of the exploit and subordinate steps on the bottom line. In this example I have chosen another situation in which a there is apparently a clear physical constraint in the factory concerned. However through just a few simple changes to the way the factory works in relation to the constraints (policy changes) they also were able to move from an overloaded situation to being able to meet all demand with the expected lead time.


BTW. If you have any similar examples please share them with me. I will publish them (if there are not too many!

2nd Example of the 5 Focusing Steps in Action

Exploiting the constraint in a coatings (for automotive) factory

Before I arrived at the factory I knew that factory management was lobbying for more vessels to hold paint. They claimed their constraint was the number of storage vessels; they had already submitted a project to install 2 additional vessels.

0T1 5 Steps

This time I ran a simple simulation to show the impact of properly exploiting the constraint. Participants were supervisors from the factory and plant management. The simulation went well, the people got the idea and began discussing the constraint. I did not believe the constraint was the vessels since I also knew that quality control had limited capacity due to illness and an accident that reduced capacity by a large amount. Because evaluating colour takes several years to learn adding people to quality control was not going to work.

I led the team to the idea that quality control is the constraint of the system. Initially they were doubtful but when they began to think about the quality control job and the amount of time actually spent evaluating colours it became clear that quality control, even with 2 of their 4 people out of action, had enough capacity to do the job of colour quality control correctly. The decision made was that the colour experts would do only colour evaluations. To collect samples they would no longer walk back and forth between the lab and the factory; they would no longer add the corrections to the mix vessels and they would not wait until mixing was complete. Other employees were found to make the corrections (weighing pigments and adding these to the mixing vessels), people were found to collect samples and the quality control experts found ways to reduce the number of corrections needed. All these actions were "subordinate to the constraint” actions – subordinate to decision that the two colour experts in QA would focus only on colour evaluations.

Once all the actions the team decided were implemented the factory enjoyed a 40% increase in capacity – and no longer needed to buy any added vessels.

IMG 0420

On Clear Days you can see Corporate HQ - 8

Why the 5 Focusing Steps are so Important

Most middle and senior managers do not understand or simply are not interested in how their business system works. They are content to focus on their local department and optimise that – rather than understanding the business as a whole to cause it to maximise results. Even top management (CEOs) often do not understand their business. They condone and even encourage their management teams to optimise their local departments – production, marketing sales, finance etc. Wherever local optimisation is the rule the business concerned will always harm the bottom line significantly. Local optimisation is a massive mistake!

The 5 Focusing Steps are guidelines that, properly used, will cause a management team to always reflect on their (local) decisions. Doe the action or decision taken locally help or damage the business as a whole? As we will see the 5 Focusing Steps are a guide, but they do not replace a deep understanding of the business system.

What follows is a first example of the impact of the exploit and subordinate steps on the bottom line. In this the first example I have chosen a situation in which a there is a clear physical constraint in the factory concerned. However through just a few simple changes to the way the factory works in relation to the constraints (policy changes) they were able to move from an overloaded situation to being able to meet all demand with the expected lead time.

Examples of the 5 Focusing Steps in Action

Exploiting the constraint in automotive component production

The factory produces a major component for both cars and trucks. Production involves a series of steps followed by an automated assembly and lastly some manual final assembly. The company invited me to a meeting with the plant manager to discuss how TOC (and the 5 Steps) could solve his problem of insufficient capacity.

The plant manager's problem was demand far exceeded the factories capability to supply (by about 25%). Instead of a discussion with the him, he confronted me with 16 sceptical engineers who had been working on the problem already for a very long time.

0T0 5 Steps

I explained the 5 steps and their importance. This led to a discussion about the location of their constraint. With 16 engineers in the room consensus was difficult. After a while it became clear that they believed either a metal turning step or the final manual assembly step were the possible constraints. I explained that it is unusual to find the constraint at the end of a production line simply because month end pressures to meet sales targets ensure plenty of capacity there. They finally agreed that the best candidate was the turning machine in a line (they had 10 lines).

From there it was easy. I asked them how many hours per day the constraint machines would be producing. They claimed constantly except for set-ups. I asked to see these machines. We went to 5 lines and found that in 3 of them (60%) the turning machine was idle. They were idle for set-ups (but no set up person was present) and one was idle for a break. Clearly they were losing capacity at the constraint and therefore for the factory.

Back in the conference room the engineers came up with many ideas to make sure the constraint never stops (apart from actual work doing set-ups). They also came up with ways to accelerate set-ups significantly. Most of the changes could be made immediately (some did require the OK from their union). The result was they easily discovered the 25% of capacity needed to meet demand!

To exploit the constraint they had to find ways to shorten set-ups; they had to find ways to cover for breaks, meals and shift changes and they eventually found ways to move material between production lines since the constraint was not equally loaded across all 10 lines.

IMG 0353